- Is based on haemoglobin oxygen carriage (and thus oxygen saturation)
- Rather than PaO2
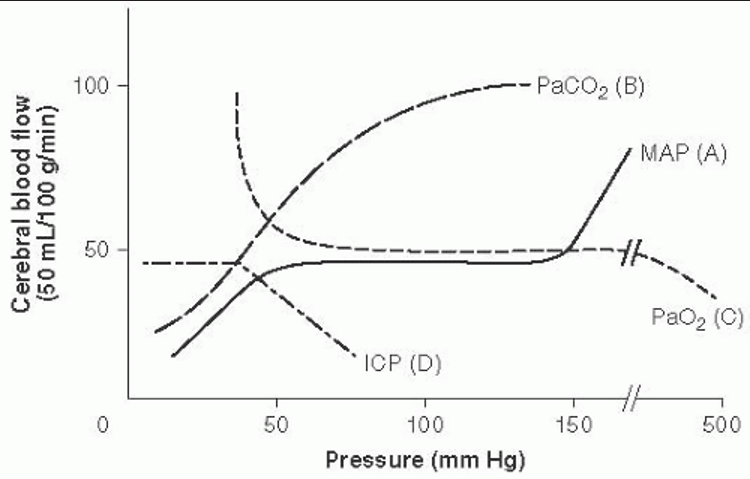
- CBF (flow) is unchanged until arterial oxygen tension (PaO2) falls below about 7 kPa (53 mmHg) but rises sharply below that, such that raised ICP may occur in hypoxic individuals.
- Because of the shape of the haemoglobin-oxygen dissociation curve, CaO2 is relatively constant over this range of PaO2.
- Below about 7 kPa (53mmHg), CBF exhibits an inverse linear relationship with CaO2.
- Hypoxemia-induced vasodilation shows little adaptation with time but may be substantially modulated by PaCO2 level
- Oxyhemoglobin dissociation curve
- Shifts in oxyhemoglobin dissociation curve (ODC) reflect local tissue oxygen needs. Can be helpful (meets metabolic needs) or harmful (in toxicities, pathophysiologic situations).
- Right shift in ODC reflects ⬇️ Hb affinity for O₂ → ⬆️ O₂ unloading at tissue. Physiologically occurs with ⬆️ O₂ needs: exercise, ⬇️ pH, ⬆️ temperature/fever, hypoxia (⬆️ 2, 3-BPG); at the cellular level, caused by ⬆️ H⁺ and ⬆️ CO₂ created by tissue metabolism (Bohr effect).
- Left shift in ODC reflects ⬆️ Hb affinity for O₂ → ⬇️ O₂ unloading at tissue. Physiologically occurs with ⬇️ O₂ needs (⬇️ temperature) and pregnancy (fetal Hb has higher O₂ affinity than adult Hb, and ⬆️ O₂ binding due to ⬇️ affinity for 2,3-BPG → left shift, driving O₂ across placenta to fetus). Pathologically occurs with ⬆️ CO, ⬆️ MetHb, genetic mutation (⬇️ 2,3-BPG). Left is lower.
- ODC has sigmoidal shape due to positive cooperativity (i.e. tetrameric Hb molecule can bind 4 O₂ molecules and has higher affinity for each subsequent O₂ molecule bound). Myoglobin is monomeric and thus does not show positive cooperativity; curve lacks sigmoidal appearance.
 Made with Bullet