Summary
- Differentiating among treatment necrosis, pseudoprogression, and tumor recurrence is expected to become even more complicated as additional treatment modalities (such as immunotherapy, antivascular agents, and gene therapy) are included for brain tumor treatment.
- The addition of immunotherapy and chemical agents may enhance multiple apoptotic pathways through several metabolic pathways, resulting in an increased risk of developing treatment necrosis and pseudoprogression.
- This may be one of the reasons behind the higher incidence of treatment effects and pseudoprogression with multimodality therapies.
- The inclusion of additional treatment methods also reduces the specificity of contrast enhancement as a surrogate marker for defining disease progression, thereby requiring appropriate adjustments in the imaging criteria, as discussed in the next section.
Radiation necrosis | Tumour progression | Pseudoprogression | Pseudoresponse (Generally for post chemo rather than post radiotherapy-I add it here just for comparison sake) | |
Timing | 3 months to years post radiation | Up to 12 weeks after Post RT | ||
MRI | ||||
-T1+C | Increase in enhancement in the tumour bed but without actual tumour | Increase in enhancement in the tumour bed with actual tumour Does not diminish with time | Increase in the nontumoral enhancing area Diminish with time | Decrease in the enhancing area |
Increase perilesional oedema Does not diminish with time | Increased peritumoral oedema that diminish with time | Increase peritumoural oedema does not diminish with time | ||
-Flair | Flair shows hyperintensity | Flair shows hyperintensity | Flair shows hyperintensity | |
DWI (not consistent) | Generally Less cells, less restriction, higher ADC values (but gliosis can decrease ADC values in radiation necrosis | Generally more cells, more restriction, lower ADC values | ||
MRS | Compared to tumour -Raised Cho/NAA ratio -Raised Cho/Creatine ratio Compared to normal brain -Reduced NAA/Creatine ratio | Compared to tumour Very Raised Cho/NAA ratio Very Raised Cho/Creatine ratio Compared to normal brain Very Reduced NAA/Creatine ratio | ||
MR Perfusion | Reduced rCBV (>2.6) Reduced enhancement rate (dI/dt) | Raised rCBV (>2.6) Raised enhancement rate (dI/dt) | ||
PET | Decrease metabolic activity (glucose uptake) | Increase metabolic activity (glucose uptake) | ||
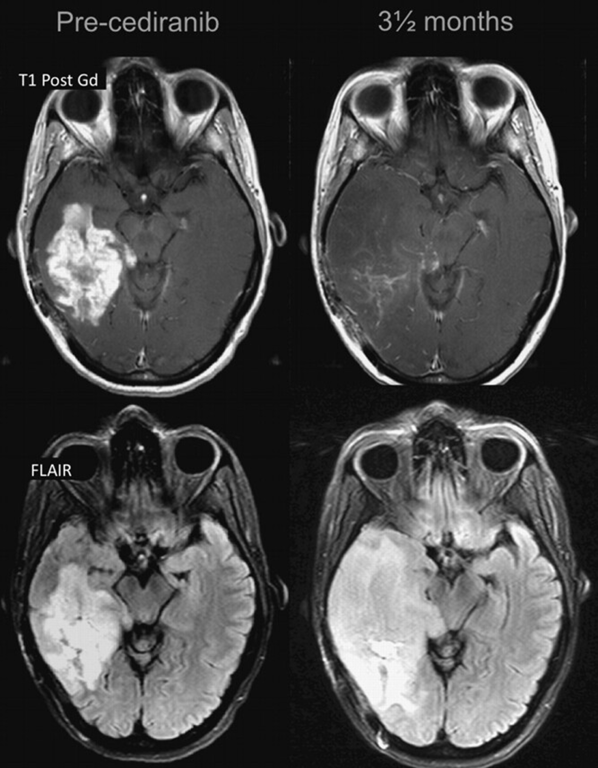
Pathology | Percentage of tumour cells present low Blood vessel damage → ischemia → necrosis → increased capillary permeability → fluid transudation → consequent brain oedema. | Percentage of tumour cell present high Progressive growth | Vasodilation → disruption of the BBB → oedema | ◦ Antiangiogenic agents such as bevacizumab, an anti-VEGF antibody, and cediranib, a VEGF receptor tyrosine kinase inhibitor → reduce angiogenesis → reduce vascular permeability → falsely reduce contrast enhancement ◦ Reversibility of this vascular normalization, with rebound enhancement and edema, was noted when patients required a “drug holiday,” mostly due to toxicity, with a “re-response” after restart. |
Differentiate | Biopsy (Tumour progression vs Radiation necrosis) | Biopsy (Tumour progression vs Radiation necrosis) Repeat MRI (Pseudoprogression vs Tumour progression) | Repeat MRI (Pseudoprogression vs Tumour progression) | |
Notes | If MRI changes stay for more than 12 weeks then call it radiation necrosis |
3 different types of effects of brain RT can be identified on the basis of the time
Acute
- Timing
- During the period of radiotherapy
- Pathology
- Due to
- Vasodilation → disruption of the BBB → oedema → raised ICP
- Clinical features
- Headache
- Nausea
- Somnolence
- MRI
- No changes
- Management
- Spontaneously resolve and do not require additional treatment
- Symptomatic management
- Corticosteroids
Pseudoprogression (Subacute or early-delayed)
- General
- Mimics tumor progression
- Early necrosis
- Do not use the term necrosis
- As no cell death here just disruption of BBB from radiation
- These types of necrotic lesions should not be considered strictly radionecrosis because they are included in the treatment effects, implying a potential difference in patient outcome.
- Treatment necrosis
- When using concurrent chemotherapies, such as temozolomide (TMZ), development of radiation necrosis is more likely and often occurs sooner during the early-delayed period.
- Therefore, researchers have interchangeably used the terms treatment necrosis and pseudoprogression in the literature.
- However, pseudoprogression is different from radiation necrosis, because these lesions and associated clinical symptoms recover spontaneously.
- Shortly after completion of RT, patients with high-grade brain tumors can present with an increase in contrast-enhancing lesion size, followed by subsequent improvement or stabilization without any further treatment
- MacDonald criteria (updated by Response Assessment in Neuro-Oncology working group)
- Based on 2D tumour measurements made in MR imaging scans, in conjunction with clinical assessment and corticosteroid dose.
- Differentiating progression and pseudo-progression:
- Definition of disease progression (tumour recurrence) within the first 3 months (early-delayed time period) only
- If the new enhancement is observed outside the radiation field OR
- Tumour progression is considered to have occurred when an increase of >25% in the size of the contrast-enhancing lesion is observed.
- If any histopathological confirmation exists.
- Association between the incidence of pseudoprogression and increased survival;
- Perhaps pseudoprogression = an active “inflammatory” response against the tumour
- Timing
- Up to 12 weeks after radiation ends
- Pathology
- Due to
- Vasodilation → disruption of the BBB → oedema → raised ICP
- Correspond to gliosis and reactive radiation-induced changes without evidence of viable tumour
- Clinical features
- Asymptomatic
- Headache
- Nausea
- Somnolence
- MRI
- Non-enhancing white matter T2-signal hyperintensities and new or enhancing contrast-enhancing lesions in proximity to the irradiated tumour site on imaging
- Vary from oedema to new lesions or increased size of contrast-enhancing lesions within the immediate vicinity of the irradiated tumor volume
- Only method of distinguishing pseudoprogression and early progression of disease is to perform follow-up examinations of the patients because conventional MR imaging is unable to differentiate the 2 and alternative techniques have not yet been validated in prospective trials.
- Management
- Rescan in 4-6 weeks
- When pseudoprogression is likely to resolve
- Spontaneously resolve and do not require additional treatment
- In some cases, appears to progress with time into radiation necrosis or treatment-related necrosis
- Symptomatic management
- Corticosteroids
- MGMT promoter
- Cells that are deficient in MGMT have shown an increased sensitivity to TMZ → Patients with low MGMT expression (due to methylation of the promoter) benefit more from adjuvant TMZ.
- MGMT promoter status may predict pseudoprogression in >90% of patients with methylated glioblastoma.
- 60% probability of early true tumour progression was observed in unmethylated MGMT promoter tumours
- Although it can occur following RT alone, pseudoprogression is widely believed to be more frequent following concomitant RT-TMZ
Radiation necrosis
- Late: 3 months to years after radiation treatment,
Incidence
- 3%–24%
- < 5% of patients treated with conventional fractionation regimes,
- But a higher proportion when large doses per fraction are used and when larger volumes of normal brain are included.
- Post radiosurgery incidence of radionecrosis 25%.
Pathology
- Marked enhancement in the tumour bed but without actual tumour
- Blood vessel damage → ischemia → necrosis → increased capillary permeability → fluid transudation → brain oedema
- JSG:
- There is always tumour cell but the percentage of tumour cells is lower than tumour progression
Occurrence directly related to
- Total Radiation dose
- Inc. risk if total radiation dose exceeds 64.8 Gy
- Overall treatment duration
- Irradiated brain volume.
- Fraction size
- Concurrent and adjuvant use of chemotherapy + radiation therapy
- Increase the risk by at least 3x.
- This is partially attributable to the breakdown of blood-brain barrier by radiation injury, which enhances the effectiveness of chemotherapeutic agents and causes unintended injury to tissue surrounding tumour.
Clinical features: variable
- Asymptomatic
- Significant neurological deficits
- Due to
- Raised intracranial pressure
- Damage to normal functioning brain
Radiology
CT-not good at differentiating
- Shared by radiation-induced adverse effects and tumour recurrence
- Diffuse hypo-intensity of the white matter extending into and compressing the overlying cortex likely caused by oedema
- Enhancing focal areas of lucency suggesting necrosis,
- Irregular and/or extensive contrast enhancement
- Mass effect
MRI-not good at differentiating
- Difficult to distinguish from recurrence.
- Increased incidence in white matter and manifests on conventional imaging similar to a malignant tumour with contrast enhancement, oedema, and mass effect
- Some of the imaging features most commonly reported to be shared by tumour recurrence and treatment necrosis include
- Origin near the primary tumour site
- Contrast-agent enhancement
- Vasogenic oedema
- Growth over time
- Mass effect
- Treatment necrosis > tumour recurrence
- Conversion from a non-enhancing to an enhancing lesion after radiation therapy,
- Lesions appearing distant from the primary resection site,
- Corpus callosum or peri-ventricular white matter involvement,
- “Swiss cheese” or “soap bubble” shape patterns
DWI-a lot of limitations still
- ADC
- ADC estimates the mean diffusivity of water molecules within each voxel (in mm2 /s), assuming isotropy along each direction of movement
- Tumour recurrence has greater cellularity than treatment necrosis, and therefore, lower ADC values are expected, compared with treatment necrosis → this has not been consistently shown in studies
- One study reported significantly higher ADC values in tumor recurrence than in treatment necrosis, which could be attributable to greater extracellular space or necrotic regions within high-grade tumours.
- The ADC values in treatment necrosis can also be lower because of scarring (from gliosis or fibrosis) within the lesion, whereas oedema can elevate the ADC values, possibly because of pure vasogenic oedema, which would have greater water-molecule mobility, compared with oedema associated with tumour recurrence.
- FA
- FA captures the directionality of diffusion inside the tissue.
- FA values are typically high in healthy, normal white matter, because water molecules rapidly diffuse parallel to the white matter tracts
- White matter abnormalities that cause the loss of axonal organization produce lower FA and higher ADC values
- Factors that can affect FA values: Vascularity, cellular density, and fibre structure
- Treatment necrosis, which causes loss of cell structures and normal fibres, should produce even lower FA values than should tumour recurrence.
Perfusion
- Tumour recurrence: formation of complex networks of abnormal blood vessels with increased permeability around the tumour site that appear as regions of hyper-perfusion with higher blood volume.
- Treatment necrosis: is associated with regions of reduced perfusion because of treatment-induced vascular endothelial damage and coagulative necrosis.
- MR perfusion methods:
- Dynamic susceptibility-weighted contrast-enhanced (DSC) MR imaging
- Relies on the T2* signal drop caused by the susceptibility effect of gadolinium based contrast agents in brain tissue.
- The drop in signal correlates with the concentration of the contrast agent and can be used to measure the hemodynamic parameters.
- The hemodynamic characteristics of the tissue are quantified using 3 measures:
- Relative cerebral blood volume (rCBV)
- rCBV has been consistently reported to be promising for differentiating between tumour recurrence and treatment necrosis
- Tumour progression: Tumour has abnormal and highly permeable blood vessels growing → higher rCBV values than in normal brain tissue
- Treatment necrosis: hinders blood flow → lower rCBV values
- Relative peak height (rPH)
- Maximum change in signal intensity during the transit period of a contrast agent
- Quantitatively measure tumour vasculature and has been reported to strongly correlate with rCBV
- Higher rPH values are expected to be associated with tumor recurrence, because progressing tumours have greater vasculature than does treatment necrosis
- Percentage of signal-intensity recovery (PSR).
- Measures the degree of contrast agent leakage through the tumour microvasculature and, thus, directly reflects capillary permeability
- Growing tumors recruit abnormally formed and leaky blood vessels that are expected to increase vascular permeability and, thus, lower PSR values. PSR should therefore be lower in tumor recurrence than in treatment necrosis
- Dynamic contrast-enhanced (DCE) MR imaging
- Uses a rapid sequence of T1-weighted images to measures changes in signal intensity as a bolus of contrast agent passes through a brain tumour.
- Tumour signal intensity in DCE-MRI reflects a combination of factors, including overall perfusion, vascular permeability, and extracellular volume
- Quantitative hemodynamic parameters
- Volume transfer of contrast between the blood plasma and extracellular space (Ktrans)
- Represents the permeability of the tumour vasculature
- Shown to be higher in tumour recurrence than in treatment necrosis
- Extravascular extracellular space (Ve),
- No statistically significant differences have been reported between the 2 lesion types
- Area under the curve (iAUC)
- Provides insight into the kinetics of contrast agent accumulation by integrating the concentration of the agent observed in brain tissue over time
- Vascular dilation present in treatment necrosis, the iAUC values have been reported to be higher for treatment necrosis than for tumour recurrence.
- CT Perfusion
- Advantages over MR imaging:
- CT scanners are more widely available
- Unlike MR scanners, CT scanners do not suffer from magnetic susceptibility artifacts
- CT is less prone to errors when quantifying hemodynamic parameters because of the linear relationship between tissue attenuation and contrast agent concentration and the presence of an arterial input function.
- Disadvantage
- Ionizing radiation,
- The toxicity associated with the iodinated contrast agents,
- Lower resolution, and
- Limited image-slice volumes.
- Require an additional imaging session in a different scanner, and these requirements further limit its feasibility for use in the clinical setting.
- CT perfusion is also incapable of imaging regions outside the preselected slice(s), and therefore, the data obtained from a single scan do not permit reconstruction of other imaging planes for a more detailed study;
- PET or MR perfusion does not suffer from this problem.
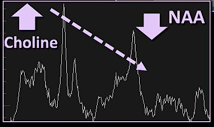
Magnetic Resonance Spectroscopy
- Measures the relative compositions of various metabolites, most commonly including
- N-acetylaspartate (NAA)
- Choline
- Creatine
- Lipid
- Lactate
- Tumour progression (when compared with normal tissue)
- Lower levels of NAA and creatine
- Higher levels of choline and lactate, and different lipid compositions
- NAA, Choline, and Creatine Ratios
- Tumour recurrence:
- Higher choline to creatine and choline to NAA ratios
- When compared to
- Radionecrosis
- Normal surrounding brain
- Lower NAA to creatine ratios
- When compared to normal appearing white matter
- Radionecrosis
- Decreased NAA
- Variable changes in choline and creatine intensities over time
- Choline has been reported to increase during the first few months after radiation therapy and then decrease as treatment necrosis begins to appear
- Lipid and Lactate
- Are released with cell destruction and, therefore, are typically absent in normal brain tissue
- Pure tumour progression
- Low amount of lipid and lactate
- But most tumour progression have areas of tumour necrosis
- Tumour necrosis
- Increased amount of lipid and lactate
- An increased amount of lipid and lactate can be found inside regions of treatment necrosis, when compared with pure tumour recurrence with no necrosis.
Nuclear Medicine Imaging
- Uses weakly radioactive medicinal compounds known as radiopharmaceuticals to image the physiological properties of organs.
- Theory
- Radiation necrosis: lower metabolism → lower tracer uptake
- Tumour progression: increased metabolism → higher tracer uptake
- 2 types of methods used for metabolic imaging of intracranial lesion
- Positron emission tomography (PET)
- Fludeoxyglucose (FDG)
- A commonly used analogue of glucose,
- Has been reported to be capable of distinguishing treatment necrosis from tumour recurrence with
- Sensitivity 65%–81%
- Specificity 40% –94%
- Cons
- FDG uptake in normal cortex is variable and may make it difficult to distinguish tumour from surrounding normal Gray matter and
- Low-grade tumours appear to be metabolically similar to their surrounding normal tissues, thus hindering the detection and accurate delineation of observed lesions
- Amino acid analogs
- Eg:
- 3,4-dihydroxy-6–18F-fluoro-L-phenylalanine (18F-FDOPA)
- O-2-18F-fluoroethyl-L-tyrosine (18F–FET)
- L-methyl-11C-methionine (11C-MET)
- May perform better than FDG, because amino acids exhibit lower uptake in the normal cortex than does glucose → better contrast than FDG → more accurate detection of growing tumours.
- Limitations
- Some conditions (e.g. epilepticus) can increase glucose metabolism in areas of the brain and may be misinterpreted as a progressing tumour
- Radiation injury can trigger repair mechanisms that increase glucose metabolism in the brain and give the false impression of tumour recurrence,
- PET images have generally low spatial resolution (5 mm) that limits their sensitivity in early detection of recurrence, and
- There are risks to patients associated with exposure to ionizing gamma radiation.
- Single photon emission CT (SPECT)
- Similar to conventional planar nuclear medicine imaging but provides additional 3-dimensional information about an organ by imaging from multiple angles with use of gamma rays
- Several radiotracers
- Thallium-201 (201Tl)
- 99mTc-sestamibi
- Iodine-123-a-methyl tyrosine ( 123I-IMT)
- 999mTc-glucoheptonate
- 99mTc-tetrofosmin
- 201Tl
- Is not incorporated into healthy brain tissue
- Has been reported to be superior to more powerfully differentiate treatment necrosis from tumour recurrence, compared with conventional structural imaging
- Sensitivity ranging from 43% to 100%
- Specificity ranging from 25% to 100%
- Cons
- Low spatial resolution
- Requires relatively large radiation doses.
- Several 99mTechnetium based tracers
- Higher photon flux →
- Better spatial resolution
- Requiring lower radiation doses than 201Tl
- Cons
- Tracer uptake in the normal tissues of the choroid plexus and pituitary gland has limited their clinical use.
- Sensitivity of these tracers is also low when attempting to detect tumour recurrence in the posterior fossa region
- P-glycoproteins may also remove these tracers from tumour cells, thereby reducing their sensitivity to detect growing tumours
- Cons
- SPECT has poor spatial resolution (7 mm) and low SNR.
- The localization of radiotracer uptake is also difficult in SPECT, because its low spatial resolution does not allow accurate registration of the functional images with the anatomical images
Management
- Supportive
- Steroid to reduce accompanying oedema,
- Antiseizure medication as required
- Close clinical and radiological surveillance.
- VEGF inhibition
- Bevacizumab, a humanized anti-VEGF monoclonal antibody in patients with symptomatic radionecrosis who do not respond to steroids.
- Nobel 2025
- Bevacizumab for the treatment of SRS-induced RN was associated with a
- High initial response rate,
- Significant lesion reduction
- Prolonged clinical improvement.
- High rate of lesion regrowth of RN (50%) at around 7 months
- Poor response to Bev re-challenge
- Hyperbaric oxygen therapy (HBO)
- Enhancing oxygen delivery to damaged tissue by increasing plasma oxygen carriage enhances recovery.
- Surgery
- Indicated for mass effect that does not respond to steroid treatment or other medical management.
Pseudoresponse
- Characterized by a marked decreased in the enhancing portion of the lesion some months after initiation of treatment. However, in some such cases, the FLAIR sequence shows a clear expansion of the lesion
True Progression
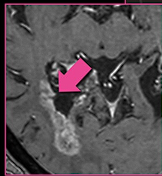
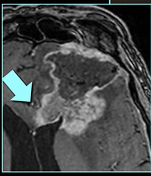
- MRI features (by Lea Alhilali)
- Sub ependymal enhancement
- 93% sensitivity for tumour progression
- Not very commonly seen (38%)
- Crosses corpus callosum
- Is only statistically significant if it appears with multiple enhancing lesion
- Reverse hunter angle
- Increased Choline
- Decreased NAA
- Low ADC value
- Hypointense on ADC and T2
- “If ADC < 1000, 1000% sure it is tumour”
- Increased rCBV on perfusion
- rCBV >1.75 suggestive of tumour when compared to contralateral hemisphere
 Made with Bullet